
Machine learning and in particular deep neural networks have been all the buzz in recent years. They have become popular topics in all industries ranging from facial recognition to predicting equity returns. I’m going to present two little projects that I’ve recently worked on. The first being using deep neural networks in derivatives pricing or in the case that I used it , finding implied volatilities. This allows someone to skip over the steps of either Black–Scholes or finite differences depending on the asset and just focus on current market data. Due to my limited access to data it may seen not fully complete as it serves as a proof of concept. The second experiment was to prove that technical analysis has limited if any ability to predict asset returns. Technical analysis and technical trading is using a series of signals on a chart to indicate if that equity is a “buy” or “sell” and is what most people think of when trading comes to mind. Unfortunately for technical day traders this is a cargo cult (pseudoscience).
Deep Neural Network Option Pricing
Hypothesis
By using current market data and a deep neural network consisting of input layer , output layer, and several hidden layers, it is possible to accurately calculate the implied volatility of American options. Methods ( skip this if you don’t want to read the details of the machine learning model or activation functions I picked)
Methods ( skip this if you don’t want to read the details of the machine learning model or activation functions I picked)
Received SPY American call option chain for every expiration and every available strike. Solved for implied volatility using gjr-garch underlying volatility and the mid of the contract using the reverse finite difference method. In NAs appeared they were cut out. I then did a 80/20 test train split. The dependent variable (Y) selected was the implied vol. The independent variables (X) were Strike, Bid, Ask, Mid, Volume, Open Interest, and maturity(days left divided by 272). Using the Keras package I created a deep neural network consisting of an input layer with 400 nodes and an activation function of Rectified Linear Unit there was then 4 hidden layers each with 400 nodes and all using the same Relu activation function. The output layer was 1 node since there is only one output variable and it had the activation function of tanh. The model uses the mean squared error as the loss function and optimizes with RMSprop. I ran the model with 100 epochs and batch sizes of 10 with a validation split of 20%. Mean average error was also displayed.
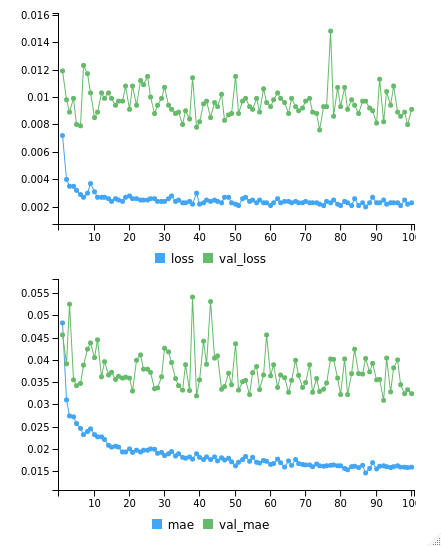
Results
The training set had a MSE of 0.23% and a MAE of 0.0159. On the test set the MSE was 6.79% and a MAE of 0.1272 meaning there is evidence of over-fitting the training set.
Further reading/research
With more data I’d like to test this again with bid ask volume and some other variables ranging from deltas to historical IV. The paper below served as the basis and I would like to replicate that paper some more.
http://cs230.stanford.edu/projects_fall_2019/reports/26260984.pdf
Technical analysis DNN
Hypothesis
Technical analysis is unable to predict returns
Methods
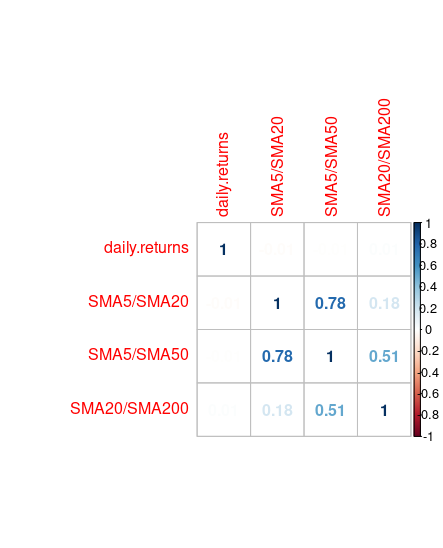
Taking the daily returns of SPY and encoding positive return days as a 1 and negative return days as a 0 these serve as the dependent variable used in this classification problem. Then producing 3 signals all lagged by one day so it is the previous close signal. Signal 1 is the 5 day moving average dividend by the 20 day if positive this is suppose to indicate high momentum. Similarly the other two signals are the 5/ 50 day and the 20/200 day moving averages. The neural network is created with an input layer of 512 nodes and a relu activation function. The two hidden layers are 128 nodes and 64 nodes with the same relu activation function. The output layer is 1 node and uses a sigmoid activation function. The model uses a binary cross entropy as a loss function and RMSprop as an optimizer. The model is ran 15 times with a batch size of 5.
Correlation matrix
As you can see from the correlation matrix there is no significant correlation between the signals and a positive next day return.
Results
The model had an accuracy as 54.51% on the training set and a similar result of 56.11% on the the testing data set. This shows that these simple technical trading skills have little to predict actual returns of the asset. Further research is to be done on more advanced signals that are common.
